Wildfire near Chefchaouen
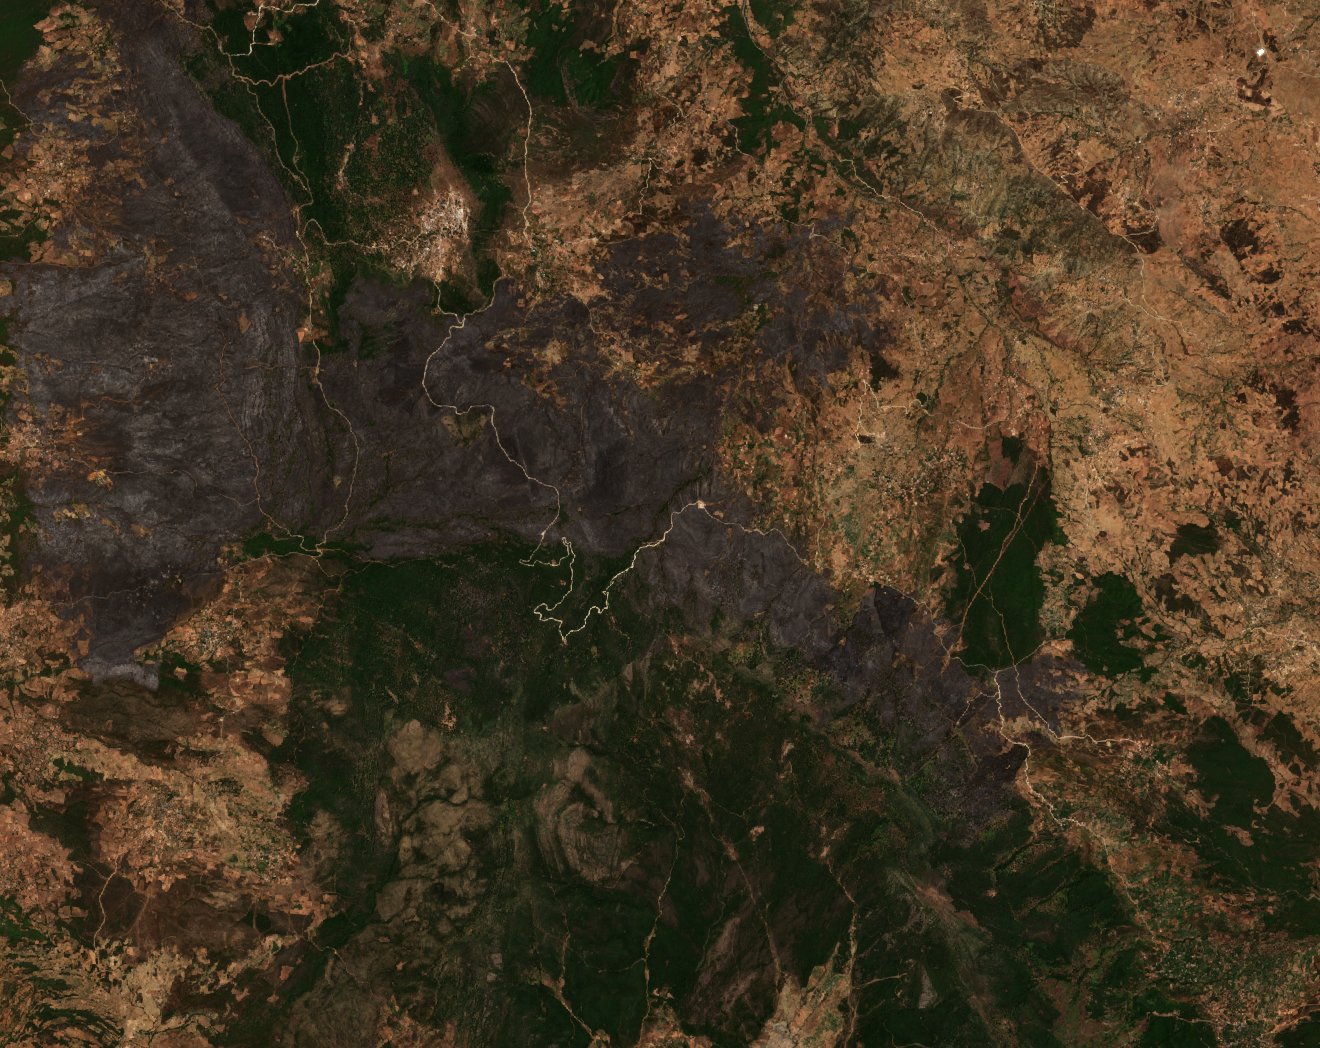
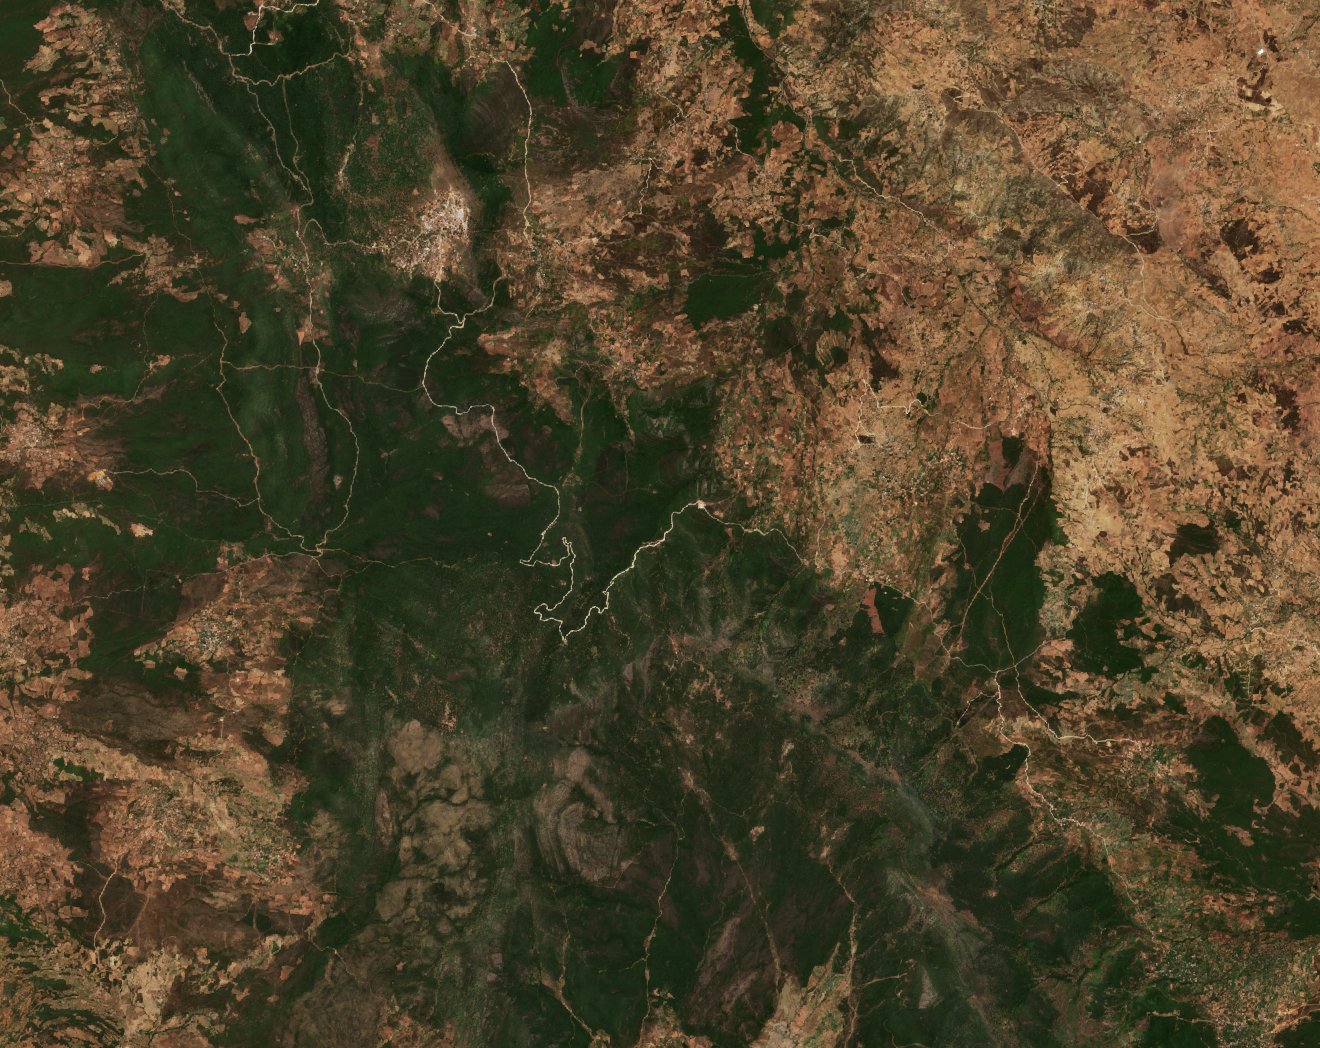
7007 hectares burned near Chefchaouen, 23 km away, Marokkó. The fire burned between July 25, 2022 and August 1, 2022. On Sentinel-2 satellite imagery at 15-meter resolution — roads and even houses are visible at this scale.
🛰 Megnézem a felvételeket ▼Before and after
Drag the slider or click anywhere on the image. Arrow keys work too. Any two dates can be compared — pick below which one to show on the left and which on the right.
The whole period, image by image
15 cloud-free Sentinel-2 images between July 17, 2022 and October 5, 2022. The orange outline is the burned area measured by Copernicus EMS.
Other fires we track in high resolution
Before/after sliders and day-by-day Sentinel-2 replays.
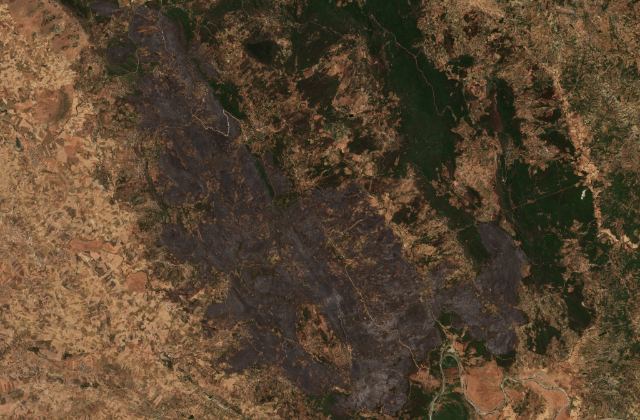 Ksar El Kebir
14,379 hectares · Marokkó · 15 images
Ksar El Kebir
14,379 hectares · Marokkó · 15 images
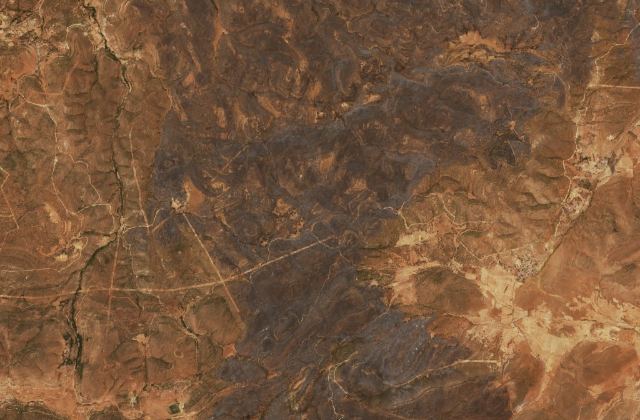 Boubker
7,519 hectares · Marokkó · 13 images
Boubker
7,519 hectares · Marokkó · 13 images
 in United States
449,041 hectares · United States · 29 images
in United States
449,041 hectares · United States · 29 images
 Aykhal, Yakutia
228,414 hectares · Russia · 12 images
Aykhal, Yakutia
228,414 hectares · Russia · 12 images
 in Democratic Republic of the Congo
185,850 hectares · Democratic Republic of the Congo · 13 images
in Democratic Republic of the Congo
185,850 hectares · Democratic Republic of the Congo · 13 images
 Clinton, British Columbia
169,309 hectares · Canada · 7 images
Clinton, British Columbia
169,309 hectares · Canada · 7 images
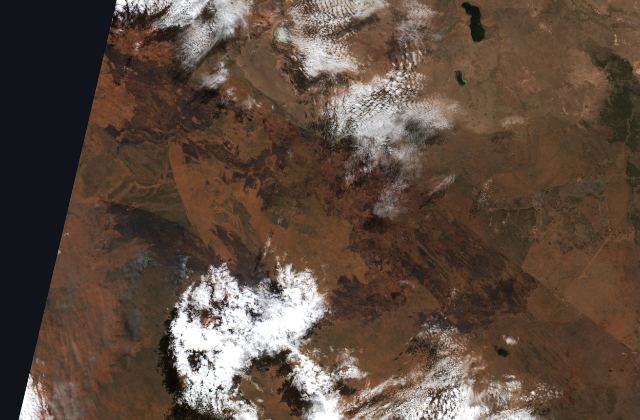 Tennant Creek, Northern Territory
137,014 hectares · Australia · 12 images
Tennant Creek, Northern Territory
137,014 hectares · Australia · 12 images
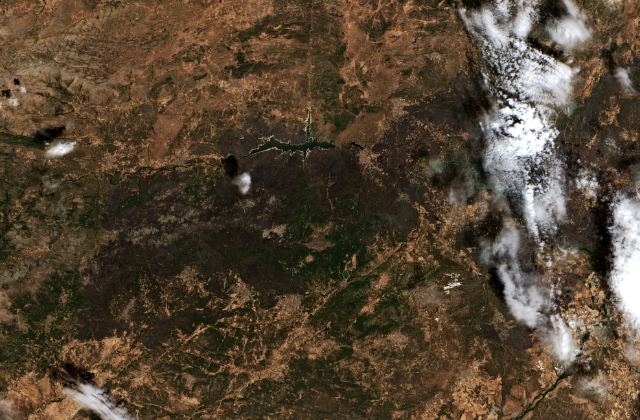 El Tiemblo
132,196 hectares · Spain · 13 images
El Tiemblo
132,196 hectares · Spain · 13 images
This page is built by Digital Dynamics Kft.: we download and process the satellite imagery ourselves and serve it from our own EU servers — this is what we do.
What does this image series show?
The Copernicus Sentinel-2 satellite pair passes over the same area every two to three days, capturing the surface at a native 10-meter pixel size. This crop is 20 km wide, so we sized it to 15-meter pixels — the 7,007-hectare burn scar fits in one view and the detail survives.
The before/after slider shows a difference that took only days to appear. On the fresher images the fire may still be actively burning — smoke partly covers the scar, and the direction of the plume shows the wind.
Why is this better than the daily satellite map? The daily NASA layers on the main map are 250-meter composites: excellent at showing where and when fire burned, but not the detail. Sentinel-2 is far sharper — the trade-off is a revisit only every 2–3 days, and only cloud-free passes are usable.
- 7,007 hectares = 70 km² burned area
- First detection: July 25, 2022
- Last detection: August 1, 2022
- Location: 35.279°, -5.471° — near Chefchaouen, Marokkó
- Imagery: 15 Sentinel-2 acquisitions, 2022-07-17 – 2022-10-05
Data, reuse and liability
Satellite imagery: Contains modified Copernicus Sentinel data 2026, via the Copernicus Data Space Ecosystem. Burned-area outline and size from the Copernicus Emergency Management Service / EFFIS-GWIS (CC BY 4.0). Hotspot detections: NASA MODIS and VIIRS.
This page is for information only. Data is collected and processed automatically, without human review; satellite detection can lag, miss fires, or trigger falsely. It is not an official alert service and must not be used for response decisions — in an emergency, follow the local authorities.
Found a mistake? Write to info@digitaldynamics.hu. Operator: Digital Dynamics Kft. · Imprint · Privacy · Terms