Fire Radar — Live Satellite Wildfire and Hotspot Map
Every dot is a place where one of seven satellites measured a surface significantly hotter than its surroundings. The color shows the age of the signal: yellow is the freshest, red is hours older. The brownish outlines are areas that have already burned — those are mapped afterwards from the scorched surface, so they can lag days behind the fire.
We pull the data every 20 minutes, but each satellite only passes over the same spot about twice a day. This page informs, it does not alert: no signal here does not mean no fire — satellites cannot see through cloud.
Burning right now — worldwide
Mapped outlines of the current season, in hectares. Click a row and the map jumps there.
 Algeria Algeria
 Spain
Spain Turkey Algeria
 Bosnia and Herzegovina Spain
 Szerbia Algeria
 Montenegro Bosnia and Herzegovina Algeria Bosnia and Herzegovina Turkey
Where the most signals are
Where satellites detected the most heat signals in the past day. Click a country and the map jumps there, drawing its border.
Szerbia Italy
Italy Ukraine
 Russia Turkey Algeria
 Irak
Irak Albania
 Romania
 Libya
Libya United Kingdom Spain
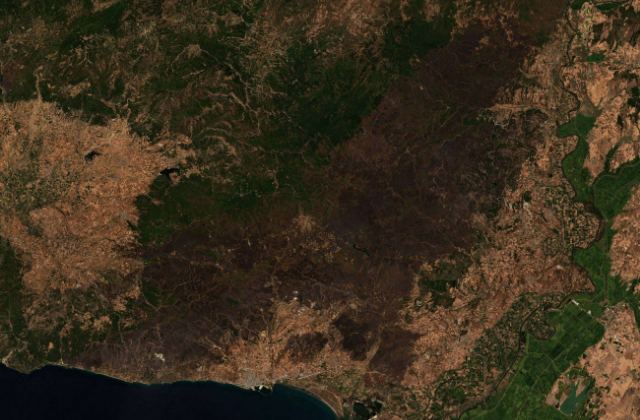 🔥
Where is fire still burning right now?
A live list of fires still burning — fresh satellite signals, with high-resolution tracking.
→
🔥
Where is fire still burning right now?
A live list of fires still burning — fresh satellite signals, with high-resolution tracking.
→
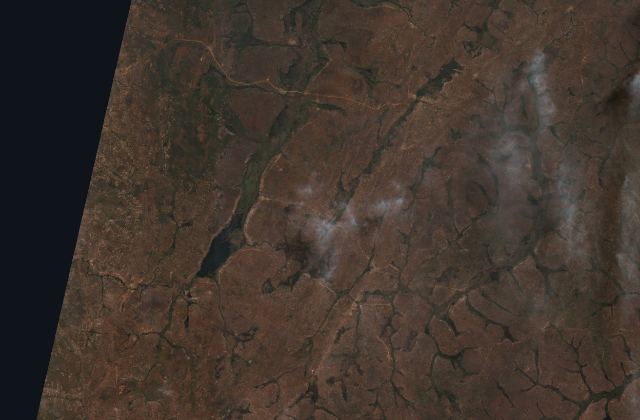 🛰
See from satellite what has burned
The largest fires on 10-meter imagery, replayed day by day — with a before-and-after slider.
↓
🛰
See from satellite what has burned
The largest fires on 10-meter imagery, replayed day by day — with a before-and-after slider.
↓
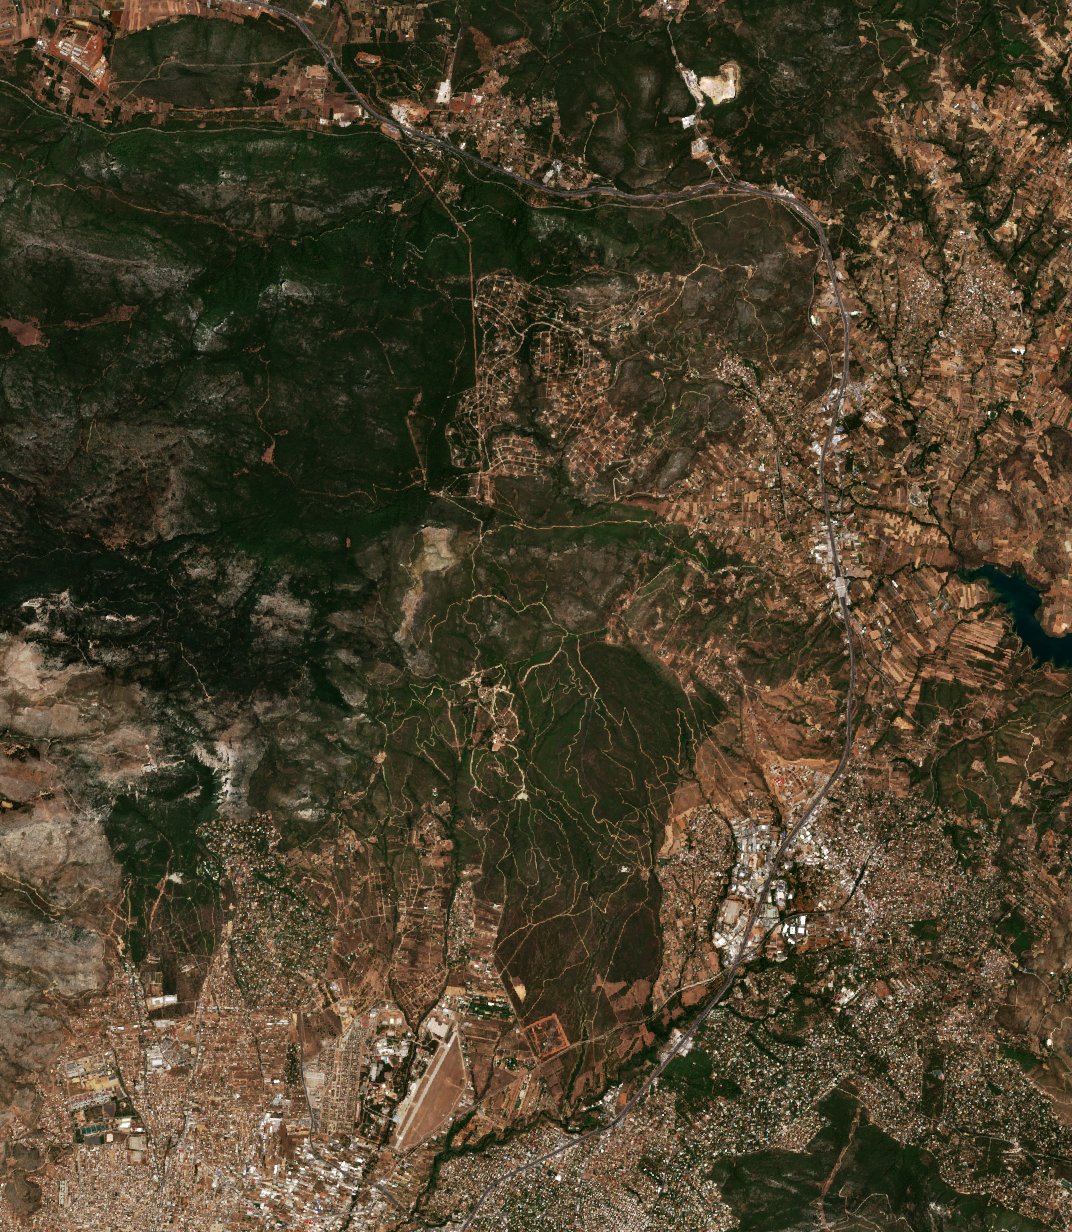 🌱
What happened after the fires — did the forest grow back?
Year-by-year follow-up: the biggest burn scars on same-season satellite imagery, with a comparison slider.
→
🗓
Look back: what burned since 2012
Thousands of large fires on a map, ranked and replayed year by year — the biggest scorched 82,210 hectares.
→
🌱
What happened after the fires — did the forest grow back?
Year-by-year follow-up: the biggest burn scars on same-season satellite imagery, with a comparison slider.
→
🗓
Look back: what burned since 2012
Thousands of large fires on a map, ranked and replayed year by year — the biggest scorched 82,210 hectares.
→
Daily hotspot counts
How many hotspots satellites detected per day across Europe.
Where the world is burning right now
Satellite heat detections of the past day, summed by region from the same 0.5° global grid the world map shows. Refreshed every 20 minutes.
Loading the regional totals…
The biggest wildfires since 2012 — 60 largest at true scale, plus a day-by-day world replay →
Wildfire seasons around the world
North America. The season typically runs June–October: the US West and interior British Columbia peak in late summer, while boreal Canada and Alaska can flare from May. Autumn wind events (Santa Ana, Diablo) extend the danger into November in California.
Mediterranean Europe. July–September is the hard season in Portugal, Spain, Greece, Italy and the Balkans — heat waves plus dry easterly winds drive the largest burned areas of the continent. This is the region where our burned-area outlines are the most complete (Copernicus EFFIS).
South America. The Amazon's burning season peaks August–October, tied to the dry season and land clearing; the Cerrado and the Pantanal often peak slightly earlier.
Africa. The savanna belts produce more fire detections than any other landscape on Earth — north of the equator roughly December–March, south of it June–September. Most of it is seasonal grass burning, not forest loss.
Australia. The southeast's bushfire season runs December–February, the tropical north burns in the dry season (May–October).
Boreal Eurasia. Siberian fire seasons run May–August and can produce the largest single fire complexes of the planet, often far from any road.
These are climatological patterns, not forecasts — any given year can deviate sharply. The live map above always shows the current situation.
What has burned? — the largest fires from satellite
The largest burned areas of this season on NASA satellite imagery, replayed day by day. Pick one from the list and drag the slider — the burn scar appears before your eyes. Outlines are measured by Copernicus EMS. Detailed imagery is available for the European fires; elsewhere the map still shows every hotspot live.
What this map shows — and what it does not
Satellites do not see fire itself — they see a thermal anomaly: a point on the surface significantly hotter than its surroundings. Most of the time this really is fire — wildfire, stubble burning, leaf-litter fire — but the same signal is triggered by industrial chimneys, gas flares, smelters, and sometimes even sun glint . A single dot on its own is not proof; many dots in one place, however, tell a story.
What you cannot see may still be there. A satellite passes over a given place only a few times a day, and cloud hides fire. A blaze that flares up at night and is put out by morning can be missed entirely.
Hotspot, cluster, burned area — three different numbers. A hotspot is a single satellite detection; a big fire can produce hundreds per day, so the raw count is misleading. A cluster merges nearby detections — it answers how many places are burning. The burned area is an outline computed afterwards from the scorched surface, in hectares — it tells you how big the fire was. By its nature it lags the hotspots by a few days.
Colors show the age of the signal : yellow is the freshest detection, red and ember tones are hours older. Over Europe we show every detection as its own dot; the world view condenses them into 0.5° cells — there are tens of thousands of hotspots worldwide on a single day, too many to load point by point. Zoom in anywhere and the map switches to individual detections.
This page is not an alert service. It is made for information, and for the reasons above it can be neither complete nor instant. In an emergency, call 112 (EU) or your local emergency number.
Frequently asked questions
What does this live wildfire map show?
Every dot is a satellite heat detection (a "hotspot"): a place where one of seven satellites measured a surface significantly hotter than its surroundings. Yellow dots are the freshest detections, red ones are hours older. Brownish outlines are burned areas, mapped afterwards from the scorched surface.
How often is the map updated?
We pull fresh detections every 20 minutes, around the clock. Each satellite passes over the same spot roughly twice a day, so an individual location is revisited a few times per day in total.
There is a fire near me but the map shows nothing. Why?
Three common reasons: cloud cover hides fire from satellites; the fire may be too small or too brief to be caught between two overpasses; or the detection has not arrived in the 20-minute feed yet. No signal on the map never proves there is no fire.
What is the difference between a hotspot, a cluster and a burned area?
A hotspot is a single satellite detection — a large fire can produce hundreds a day. A cluster merges nearby detections and answers "how many places are burning". A burned area is the outline measured afterwards from the scorched surface, in hectares — it tells you how big the fire actually was.
Does the map cover the whole world?
Yes. The world view condenses detections into 0.5° cells; zoom in anywhere and the map switches to individual detections. Burned-area outlines are mapped worldwide for the running season (Copernicus GWIS): Europe loads first, the global outlines load automatically as you zoom in.
Where does the data come from, and can I reuse it?
Fire detections and burned areas come from Copernicus EFFIS/GWIS (European Commission), built on NASA VIIRS and MODIS instruments — licensed CC BY 4.0. Satellite replay imagery is NASA GIBS. Attribution details are in the sources section below.
Is this an official alert service?
No. This page is for information only and can be neither complete nor instant. In an emergency, call your local emergency number and follow the official authorities.
Short answers on purpose — the map above is the real documentation.
This site was built by Digital Dynamics Kft.
We build live, data-driven sites like this one
Every layer of this page is our own work, built from openly available data — from the 20-minute fire collectors to the map engine running on our servers in the European Union. If your business generates data — measurements, machines, orders, customers — we are happy to turn it into a clear, live-updating interface.
But this is not all we build:
- online shops and websites, with a design of your own
- SaaS products and ERP systems
- mobile apps for Android and iPhone
- data collection, automation and map-based visualization
Or anything else that can be programmed — just get in touch.
See our work → or write: info@digitaldynamics.hu
Where the data comes from
- Fire detections and burned areas: Copernicus EFFIS / GWIS (European Commission), built on the NASA VIIRS (Suomi NPP, NOAA-20, NOAA-21) and MODIS (Terra, Aqua) instruments — CC BY 4.0. Refreshed every 20 minutes.
- Burn-scar outlines: Copernicus EFFIS rapid damage assessment; the largest events cross-checked against Copernicus EMS gradings.
- Satellite replay imagery: NASA EOSDIS GIBS — true-color and burn-scar composites, HLS 30 m and VIIRS 375 m (public domain).
- Country borders: Natural Earth (public domain) and © OpenStreetMap contributors.
- Base map: our own tiles — Tilezza · © OpenStreetMap contributors © Protomaps, rendered and served in the EU.
This page is for information only — it is not an alert system and must not be used for safety decisions. Satellite fire detection has inherent gaps (cloud, overpass timing, small or short-lived fires). In an emergency, call your local emergency number.
Sister site: Wildfire Live Map — wildfirelivemap.com